

Copyright © MMXVII SCOPAC Sediment Transport Study. All Rights Reserved


About the Study
SCOPAC Committee
Chairperson Councillor Mrs M Penfold MBE, West Dorset District Council.
Vice-
Technical assistance provided to Councillors by Mr Lyall Cairns (Southern Coastal Group Chair) and Dr Samantha Cope (SCOPAC Research Chair).
The STS 2012 update
The 2012 update of the SCOPAC Sediment Transport Study (STS) was funded by the Environment Agency under FDGiA, grant number LDW 41230, with additional contributions from SCOPAC.
It is referenced as: New Forest District Council (2017). 2012 Update of Carter, D., Bray, M., & Hooke, J., 2004 SCOPAC Sediment Transport Study, www.scopac.org.uk/sts.
Sediment Transport Study 2012
Lyme Regis to Portland Bill
1. Introduction
1.1 Physical Nature of the Coast
The southwest Dorset coast is protected by a discontinuous belt of shingle beaches, of contrasting character to the east and west of West Bay. Chesil Beach (Photo 1) in the east is by far the most extensive; a linear storm beach extending 28 km eastwards from West Bay to the ‘Isle’ of Portland (Chesilton) and for 13 km backed by the shallow Fleet Lagoon. By contrast, much smaller pocket beaches at Eype (Photo 2), Seatown (Photo 3) and Charmouth (Photo 4) separated by high headlands and backed by high eroding cliffs fringe the shoreline to the west (Brunsden and Goudie, 1997).
The difference in the nature of the coast east and west of West Bay Harbour reflects the degree of protection afforded by the shingle beaches. The huge volume of Chesil Beach almost completely protects the land behind, so cliffs only exist close to West Bay where the beach is lower. To the west, the pocket beaches offer only partial protection and major landslide systems have developed on the rapidly eroding soft-
Distinctly differing coastal systems exist either side of West Bay. To the east, the Chesil Beach shingle barrier structure represents accumulation over at least the past 7,000 years (Carr and Blackley, 1973; 1974). Although the origin of the beach is not understood fully, current opinion is that it is a relict accumulation at a comparatively late stage of evolution (Carr, 1980a; Bray, 1996, 1997a). Investigations indicate that the beach receives no significant contemporary supply and is a closed sediment circulation system, which displays relatively stable form, although subject to occasional overtopping, overwashing and slow recession landwards (Carr and Blackley, 1974; Carr and Seaward, 1991). By contrast, the coast to the west is an actively evolving highly dynamic system characterised by continuing sediment inputs from major mass movement complexes (Brunsden and Jones, 1976, 1980; Bray, 1996; High-
In contrast to the highly varied nature of the shoreline, the offshore zone comprises the relatively shallow and featureless embayment of Lyme Bay (Darton, Dingwall and McCann, 1980). The inshore zone is more varied as revealed by sampling and geomorphological mapping studies off Lyme Regis (Badman, et al., 2000; Brunsden, 2002), Seatown (Bray, 1996), West Bay (High-
Human interference involving provision of coastal and harbour defences and historical beach mining is concentrated at Chiswell (Photo 6), West Bay (Photo 7) and Lyme Regis (Photo 8) with most of the intervening areas remaining in a “natural” condition. In spite of their limited extent, the structures and practices are believed to have exerted important effects upon shoreline evolution over the past 200-
The following internet links offer further information about various aspects of this coastline:
Wessex Coast Geology by Ian West: www.soton.ac.uk/~imw/index.htm
Jurassic Coast: www.jurassiccoast.org
Dorset Coast Forum: www.dorsetforyou.gov.uk/dorset-
The Fleet Study Group: www.fleetandchesilreserve.org/the-
A major new source of coastal data is from the Defra-
In 2008, an extensive high resolution, 100% coverage swath bathymetry dataset, known as the Dorset Integrated Survey (DORIS), was collected by the Southeast Regional Coastal Monitoring program in partnership with Dorset Wildlife Trust, The Maritime and Coastguard Agency, The Royal Navy and Viridor Credits. This survey extended from the western end of the Fleet lagoon to Handfast Point and 20km offshore from MLWS. A subsequent swath bathymetry survey was collected in 2009, through the Southwest Coastal Monitoring Programme, extending offshore 1km from MLW between Petit Tor Point and Portland Bill.
1.2 Chesil Beach
Chesil Beach is an internationally renowned feature of geomorphological and biological interest (Carr, 1983a). It has been the subject of much research, discussion and conjecture and is regarded widely as one of the most important coastal geomorphological sites in Britain (May and Hansom, 2003). Lidar data is captured for the full length of the beach through the Southwest Regional Coastal Monitoring Programme, which aids further understanding of processes and morphological behaviour. It is interesting to note that despite the high level of interest, there has not been any other, more site specific detailed monitoring undertaken. Prior to discussion of its contemporary sediment dynamics within the main parts of this report, mention must be made of its known characteristics and existing ideas relating to sources of material and mode of origin.
Morphology and Sedimentology
Chesil Beach is one of three major coarse clastic (shingle/gravel) structures on the British coast and is unique in being a linear barrier beach whilst the others (Dungeness and Orford Ness) exhibit cuspate development. The piers at West Bay represent the present western terminus of Chesil Beach, but prior to change from open to closed, impermeable construction in the 1820s (Keystone Historic Buildings Consultants, 1997), Eype Beach would have been part of the same sediment transport system (Prior, 1919; Carr, 1980; Bray, 1996, 1997a). Other work is beginning to suggest that the beach could once have extended as far west as Beer Head or Otterton Ledge (Brunsden, 2002). Subsequent erosion to the west of the West Bay piers caused marked “setback” (Photo 9) and separation from the Chesil Beach system (Jolliffe, 1979; High-
The visible pebble beach consists of about 98.5% chert and flint, the remainder being pink quartzite, quartz, locally derived limestone and occasional pebbles of igneous or metamorphic rock (Carr and Blackley, 1969). Major pebble sampling programmes in the 1960s (Carr, 1969) and in 1993 (Babtie Group, 1997) have demonstrated that pebble size above low water mark increases systematically from Cogden or West Bexington in the west to Chiswell in the east, but with some inconsistencies at Wyke Regis (Photo 13) and to the west of Cogden. Beach face gradient increases eastward in accordance with the increase in pebble size in this direction. It should be noted that exact comparison between the earlier and later studies has not been possible due to use of different sampling and measurement techniques, but results suggest the broad pattern of grading has been maintained during the period between the two studies.
Below low water mark, longshore size grading is less clear and shingle is coarser and less well sorted than on the intertidal beach (Neate, 1967). On the subtidal beach, coarser pebbles are generally recorded to the east of Abbotsbury with sands predominating to the west (Babtie Group, 1997). The shingle beach was shown to extend out on the seabed down to around –20mCD at Chiswell and –10mCD at West Bay although the “active “ shingle extends only to around 50% of these respective depths. On the basis of boreholes drilled through the beach down to bedrock (Carr and Blackley, 1973), beach shingle volume was estimated at between 25 and 100 million tonnes (Carr, 1980a). The range of values reflected the uneven distribution of borehole information and the uncertain shingle volume below low water mark due to distribution in limited discontinuous horizons. Researchers have identified this wide range of volumes as a major uncertainty in understanding of the beach (Bray, 1997b).
The crest of Chesil is continuous over most of its length (irregularities exist in the Burton Bradstock area where the beach is backed by sandstone cliffs – see Photo 12 and generally increases in height from west (an average of 6.0mOD) to east (an average of 14.7mOD). Comparisons of crest height and position between an early survey of 1853 and 1993 have revealed variable trends, but with net crest recession inland of 8m to 17m in eastern parts (Carr and Seaward, 1991) accompanied by lowering of 0.5m to 2m (Carr and Gleason, 1972; Carr, 1983b; Carr and Seaward, 1990, Babtie Group, 1997). By contrast, the crest to the west of Wyke Regis either has remained stable in net position or has increased in height by up to 1.5m (Babtie Group, 1997). An important conclusion drawn from the more recent studies is that the beach crest is only sensitive to changes during the most severe storms and/or swell wave events and that the beach to the east of Wyke Regis appears to be more sensitive than that to the west. Further detailed descriptions of the beach and comprehensive lists of references to previous research are provided by Carr and Blackley (1974); Jolliffe (1979); Carr (1980a); Bray (1996) Babtie Group (1997) and May and Hansom (2003).
Geomorphological Development
Beach clast lithology has led most authors to postulate a sediment source to the west, from Devon (Fitzroy, 1853, Baden-
The most comprehensive study of Chesil pebble lithology was undertaken by Carr and Blackley (1969), who concluded that all types could be related to either local sources or to existing sites in south west England. The over-
- The initial forerunner of Chesil probably existed as a bank well offshore of the present beach some 120,000 years before present (BP). This bank was contemporaneous with the second development of the Portland raised beach. It is uncertain whether this beach would have stretched across the full extent of Lyme Bay, because raised shorelines have been identified at Hope’s Nose and near to Start Point, but substantial associated raised gravel deposits have yet to be identified;
- During the last glacial period (Devensian) when sea level was up to 120 m lower than at present, a series of sand and gravel deposits accumulated on what is now the floor of Lyme Bay. These probably comprised material from the Portland raised beach, solifluction deposits, river gravels and fluvio-
glacial deposits laid down on the floor of Lyme Bay by meltwaters at the end of the Devensian; - Formation of the present Chesil Beach began at the end of the Devensian (20,000-
14,000 years BP) when rapidly rising sea- level caused erosion of these deposits and wave action drove the sands and gravels onshore as a barrier beach; - Close to the land, the beach overrode existing sediments and the Fleet Lagoon was rapidly filled with silt, sand, peat and pebbles. Dating of peat samples retrieved from boreholes suggest that infilling began about 7,000 BP and was virtually complete by 5,000 BP. Such deposition requires shelter, so a significant barrier must have existed at this time indicating that Chesil Beach had formed at or slightly seaward of its present position by 4000-
5000 BP when sea level approached its present elevation. Cores described by Coombe (1998) suggest that the initial Chesil Beach was predominantly sandy rather than gravel- rich, with layers of shells and coarser materials indicative possibly of intervals of overwashing; - Relict cliffs abandoned in East Devon and West Dorset by falling sea levels in the early Devensian were re-
activated around 4,000- 5,000 years BP by marine erosion and supplied large quantities of gravel to the shore. Material is believed to have been yielded initially from the reworking of extensive debris aprons located at the cliff toes with erosion cutting into insitu lithologies only in more recent millennia (Brunsden, 1999). Detailed budget and sedimentological analysis indicates that some 30- 60 million cubic metres of gravel could have been supplied from these sources (Bray, 1996, 1997a; High- Point Rendel, 1997); - Much of the cliff gravels supplied to the shore are believed to have drifted to the east via a series of pocket beaches (Charmouth, Seatown and Eype) regulated by alternate “open” and “closed” transport at headlands eventually to nourish and enlarge the prototype sandy Chesil Beach which would have acted as the sink for this material (Bray, 1996, 1997a, 1997b; Brunsden, 1999);
- Coastal recession and human interventions over the past 500 years appear to have depleted the beaches to the west of West Bay and resulted in increasing prominence of headlands. It has reinforced the pocket beaches as a series of distinct sub-
cells leading to dislocation of the gravel transport pathway towards Chesil. The beach must now be regarded as a closed shingle system of finite volume and is likely to be sensitive to future environmental changes e.g. sea- level rise.
This evolutionary sequence suggests that Chesil initially formed mainly from pre-
1.3 Hydraulic Regime
Knowledge of wave conditions along this coastline has increased considerably over the past 10 years through a variety of regional studies (Posford Duvivier, 1998a; Halcrow, 2002; and Bastos and Collins, 2002), together with site-
The Southwest Regional Coastal Monitoring Programme measures nearshore waves using a network of Datawell Directional Waverider buoys. The buoy is deployed at West Bay in 10mCD water depth. Between 2006 and 2012 the prevailing wave direction is southwest-
The Chesil Beach site is exposed and influenced by large waves generated in the Atlantic: West Bay from directions between 215 and 224 degrees; Abbotsbury, between 218 degrees and 232 degrees; and Chiswell between 220 and 240 degrees. Portland wind records show that these directions coincide with prevailing wind direction for winds greater than 17 knots (230-
Automatic wave measurements are first reported for 1970/71 at West Bexington and Wyke Regis (Hardcastle and King, 1972), a pressure-
There are several records of “unusual” swell waves that have affected eastern parts of the beach. An event of this type overtopped the beach crest in February 1979. Local wave data are not available, but an offshore significant wave height of 7m and a period of 18 seconds was recorded 120 miles off the Isles of Scilly (Draper and Bownass, 1982). The crest of Chesil was overtopped and it can be postulated that this type of event may be a major factor in beach recession. A less extreme event of this type occurred on 8th March 2003 when it reprofiled the seaward crest face, exposing consolidated substrata and bedrock clay (Moxom, 2003). Frequency of major events is undoubtedly low, but difficult to determine due to scarcity of historical information and poor understanding of the formative conditions. Return periods of 1 in 50 years and 1 in 100 years, or more, were estimated by Dobbie and Partners (1980) and Draper and Bownass (1983) respectively, but there are too few records for reliable analysis. Other events affecting this coast are described by Dawson, et al., (2000) and would appear to represent tsunami generated by seabed earthquakes or submarine landslides in the Atlantic and around its shores that travel up the English Channel and impact upon Chesil. Several events are described in which high waves apparently arose out of an otherwise calm sea achieving heights of 2m to 9m with periods of up to 10 minutes. Eastern parts of Chesil directly facing the northeast Atlantic are especially exposed to such waves.
Offshore wave climates for West Bay have been determined by hindcasting based on Portland wind data covering 1974-
The Lyme Regis wave climate is less severe than for West Bay or Chesil due to greater shelter from westerly and south-
Tidal currents alone are too slow to be a significant transport mechanism in the inshore area of Lyme Bay, although powerful currents are focused around Portland Bill (Photo 14), where there is a significant potential for sediment transport. Comprehensive metering and drogue float studies off Lyme Regis and Charmouth showed that surface currents only exceeded 0.36ms-
Chesil was one of the locations for which wave modelling exercises were undertaken as part of the DEFRA Futurecoast Project (Halcrow, 2002). An offshore wave climate was synthesised based on 1991-
The shoreline under review is exposed to modest storm surges that travel up the English Channel driven by cyclonic weather systems that approach from the northeast Atlantic. Analyses of historical tide gauge records for Portland and Devonport with appropriate adjustments for local tidal levels reveal extreme 1 in 100 year sea-
2. Sediment Inputs
2.1 Offshore to Onshore Feed
The majority of beaches in the study area are composed almost entirely of shingle (Carr and Blackley, 1969; Bird, 1989; Bray, 1996), whereas the nearshore is characterised by thin spreads of medium sand separated by exposed bedrock ledges and boulder aprons. Due to their critical role in coast protection/sea defence and a history of mining losses, many studies have been undertaken to examine the possibility of natural beach replenishment by onshore feed. Without exception, all studies failed to locate suitable source materials and onshore transport pathways. The evidence is reviewed below:
- Underwater investigations by Coode (1853) and Nature Conservancy (Neate, 1967) indicated that the Chesil Beach shingle accumulation did not extend very far seaward of low water mark. The pebbles of the outer zone of Chesil Beach become replaced by sand and silt at an average distance of 100m seaward of LWM (Neate, 1967). This information is quite reliable because several diving surveys and re-
sampling operations were undertaken over the period 1960- 63 and shingle of the outer zone was consistently found to be weed/barnacle encrusted and immobile. The area was revisited by diving surveys in 1993 that broadly confirmed the earlier results and indicated that shingle extends seaward to around –10mCD (western parts) and up to –20mCD in eastern parts (Babtie Group, 1997). A distinct boundary between clean mobile pebbles and barnacle and weed encrusted immobile material was identified at –5mOD at West Bay and –10mOD at off Chiswell. Significant movement of pebbles seaward of these points some 150 to 300m seaward of the beach was not considered likely; - In 1970 the Nature Conservancy examined the area immediately offshore of Chesil by echo sounder and reported little unconsolidated material above the solid geology (Carr, 1980a). Hydrographic surveys undertaken in 1996 also revealed little coarse material further offshore and comparison of this survey with charts of 1808, 1903 and 1987 revealed that the bed had remained relatively stable over this period;
- Diving investigations off Seatown Beach revealed three distinct areas within the nearshore zone. First, the permanently submerged part of the beach face which extends 21-
30m offshore. Second, a flat mudstone shelf covered by occasional limestone boulders, patches of rippled sand and patches of clean gravel. Third, an area beginning 30- 60m offshore and extending beyond the end of the transects, composed of large limestone boulders, together with patches of muddy gravel and beds of kelp. Gravel from the beach appears free to move within the first two areas, however, the third area probably acts as a barrier, preventing the loss of beach gravel to offshore areas and preventing gravel supply to the beach from offshore, thus Seatown Beach is isolated from the offshore zone (Bray, 1986, 1996); - Boreholes offshore of Portland/Chesilton by consulting engineers for the CEGB and Dredging Investigations Ltd for John Taylor and Sons, consulting engineers to Wessex Water Authority revealed strictly limited quantities of coarse sediment (Carr, 1980a);
- Geophysical surveys in Lyme Bay revealed only very thin sandy superficial sediment cover over the sea-
bed (IGS, 1974; Darton, Dingwall and McCann, 1980). Further studies undertaken for Kerr McGee Oil by Ambios Environmental Consultants (1995) identified a thin sheet of gravel and sand in water depths of greater than 10m at around 1km offshore of West Bay and Cogden beach; - Survey extending over 1km offshore from Lyme Regis was undertaken using echo-
sounding, grab sampling, vibrocoring and sub- bottom profiling. Superficial sediments were generally sands and muds frequently overlying thin clayey gravel deposits up to 0.3m thickness. Superficial cover was generally less than 1m in total and quantities of gravel located were extremely limited (Offshore Environmental Systems Limited, 1980). Recent studies using similar methods supplemented by diver and video inspections revealed a complex bed morphology of exposed bedrock, shore platforms and two shallow channels infilled with fine sand overlying thin gravels (Badman, et al., 2000; Brunsden, 2002). Some transport of bed sands was indicated, but primarily in eastward and offshore directions; - Sidescan sonar and sediment sampling survey off the west coast of Portland and at several carefully selected locations in Lyme Bay failed to locate any substantial shingle deposits (Dobbie and Partners, 1981);
- Survey extending 4km off Seatown Beach located small quantities of shingle, some obviously immobile in water > 18m depth, the remainder trapped in pockets amongst dense boulder aprons. Large areas of seafloor were sand/silt dominated and devoid of gravel (Bray, 1986; 1996);
- Hydrographic survey undertaken off West Bay in 1999 (High-
Point Rendel, 2000) primarily identified two extensive, but thin sand sheets separated by a zone of bare seabed with scattered boulders. It was concluded that very little gravel could be identified on the nearshore bed, although seasonal or storm related exchanges with the beach were not discounted.
Analysis of Coastal Monitoring Programme data provides no evidence of onshore gravel feed and therefore, the speculative 2004 arrows have been removed.
2.2 Cliff and Coastal Slope Erosion
» E1 · E2 · E3 · E4 · E5 · E6 · E7 · E8 · E9 · E10 · E11 · E12 · E13
Publications by Brunsden and Goudie (1997); Allison (1992a; 1999a); Bray (1996 and 1997) and May and Hansom (2003) provide general reviews of the morphology and recession of the cliffs of this coastline. A series of papers referred to within the succeeding titled sections provide specific details of the cliff behaviour recorded at individual sites.
Topography is dominated by four prominent flat-
The coastal geology between West Bay and Lyme Regis comprises Liassic strata, mainly shales, marls and mudstones that weather to soft clays (House, 1993). The main hills (Black Ven, Stonebarrow and Golden Cap) are capped by poorly consolidated, sandy, Lower Cretaceous sediments. These are important sources of sediment to the coast, particularly the durable shingle-
Continuous marine erosion on a soft rock coast of relatively high relief has caused much slope instability leading to landsliding. The Cretaceous strata are permeable and introduce water to the coastal slope at the line of unconformity with the impermeable Liassic clays. When wet, the Liassic clays are liable to flow or slide. These features accelerate coastal landsliding, causing rapid rates of retreat (Conway, 1974; Brunsden and Jones, 1976, 1980; Brunsden and Goudie, 1997; Bray, 1986, 1996; Allison, 1990, 1992).
Coastal landsliding results in the formation of coastal landslide complexes, in which the backscar is separated from the beach by zones of degradation and material transport that vary between location from several tens of metres to several hundred metres in width, e.g. (Photo 15 and Photo 16). These have been the subject of intensive research, notably by Brunsden (1974); Brunsden and Jones (1976, 1980); Chandler and Brunsden (1995) and Brunsden and Chandler (1996).
The backscar retreats cyclically with short episodes of rapid retreat by rotational sliding, separated by prolonged phases of slow retreat by small scale landslide and weathering processes. The material released is passed through the system (throughput) in a more steady manner so as to give a relatively regular supply to the beach. Brunsden and Jones (1976) estimate the throughput time for the Stonebarrow landslide complex to be between 100 and 150 years and Bray (1996) estimates shorter periods for some of the other complexes. Correlation of incidences of landsliding with climatic records has led Ibsen and Brunsden (1997) to postulate a general periodicity of landslide intensity of some 30-
This analysis showed that large quantities of sediment are released in the western part of the study area between Lyme Regis and Charmouth, a result of rapid coastal retreat along this segment (Photo 15). Chert and flint gravel supply is small by comparison to that of all sediment types, but they comprise the dominant beach material because of their greater resistance to abrasion. Sand, silt and clay are easily eroded and transported offshore. The limestones form beach pebbles, but these are short-
Similar rates of cliff input are reported by Posford Duvivier (1997; 1999) who also calculated sediment yields resulting from erosion of shore platforms and the nearshore bed. Inputs from these latter sources of 20,000m³ per year were estimated from Portland Bill to West Bay and 55,000m³ per year for West Bay to Lyme Regis, entirely comprising fine material.
E1 East Devon (see introduction to cliff and coastal slope erosion)
Large-
E2 Lyme Regis and The Spittles (see introduction to cliff and coastal slope erosion)
The site of Lyme Regis comprises the valley of the river Lim that has been truncated by marine erosion. Ancient landslides are evident on the inland valley slopes with more recent failures being associated with the cliffs cut into the Liassic clays, siltstones and limestones by marine erosion. Steep sea-
A comprehensive series of investigations have been undertaken as part of the Lyme Regis Environmental Improvements Scheme developed by West Dorset District Council (High-
Sea walls have been present at Lyme Regis since before 1789 (Posford Duvivier, 1990; 1991), but protection has not been continuous and different sections were protected at different times. East Cliff and Church Cliffs (Photo 21) were subject to continuous recession at 0.45m per year over the period 1841-
The Spittles (Photo 22), immediately to the east of Lyme Regis comprises a series of ancient landslides beneath Timber Hill on the western flank of Black Ven that are interpreted by Brunsden (2002) as being remnants of once more extensive periglacial landslide slopes. A marked northwestward shift of activity is recognised, extending from Black Ven towards the A3052 in eastern Lyme Regis and upslope towards the vegetated presently inactive landslide scarp of Timber Hill. Retreat of 0.9m per year was estimated for 1841-
Significant quantities of sediment are supplied to the shore from the Spittles, as indicated by a major landslide over the sea cliffs that deposited a large debris lobe on the foreshore in 1988. However, the proportion of gravel yielded was small (370-
E3 Black Ven (see introduction to cliff and coastal slope erosion)
Black Ven is one of the largest and most active coastal landslides in Europe (Photo 15). The mass movement system is characterised by a steep upper backscar, and a series of terraces separated by scarps that extend down towards the foreshore. Material released from the backscar is transported over these terraces towards the sea by a series of mudslides, which form large lobes on the foreshore (Photo 23). Instability results from a combination of geological and hydrogeological factors coupled with continuous basal removal of material by marine erosion (Denness, 1971; Conway, 1974; Denness, et al., 1975; Brunsden and Goudie, 1981; Bray, 1986; 1996; Koh, 1990; 1992). Activity has been studied by map, air photo and field survey comparisons (Brunsden and Goudie, 1996; Bray, 1986, 1996; Chandler and Brunsden, 1995 and Brunsden and Chandler, 1996). The system can be divided into three areas according to the intensity of landslide activity: (i) a highly active central area characterised by rotational backscar failures that feed two major mudslides on the upper and mid benches; (ii) a west-
A sequence of events has been assembled by Bray (1996) as follows:
- In the 19th century, two roads connected Charmouth and Lyme Regis via traverses of Black Ven. An upper road ran inland of the backscar from Charmouth before crossing the western backscar and undercliff to reach Lyme Regis. A lower road ran direct across the undercliffs beneath the backscar. The upper and mid parts of the landslide complex must have been relatively stable for these roads to have been constructed and maintained;
- Sea-
cliff recession at 0.76m per year to the “east of Lyme Regis” occurred between 1803 and 1839. Parts of the lower, road to Charmouth reportedly had slipped into the sea by 1892, suggesting that instability progressed inland following erosion of the sea- cliffs; - A major landslide affecting the undercliffs between Black Ven and Lyme Regis is reported. Photographs (1907) show two small mudslide lobes on the foreshore beneath Black Ven. The lower undercliffs appear unvegetated and subject to recent landslide activity, but the upper undercliffs were vegetated and stable in appearance;
- Reports that the lower Lyme-
Charmouth road was closed in 1923 owing to subsidence. Thus, it appears that the road was at least partly usable for up to 30 years following the disturbances noted above, an indication of slow, but progressive increase in landslide activity within the undercliffs; - Aerial photographs of 1948 display the main backscar in a stable vegetated state and show the upper road intact. Mid and lower parts were clearly active and small mudslide lobes extended across the foreshore.
- Aerial photographs of 1958 also display the upper road intact despite large-
scale mudslide activity within the undercliffs. During these disturbances, two large mudslide lobes surged from central Bleck Ven out across the foreshore, the eastern in 1957 and the western in 1958. Degradation of the main backscar is seen in association with these mudslides, but the quantity of retreat was small, especially above the western (most recent), mudslide. The 1958 photos therefore depict the preparatory stages for a phase of rapid backscar retreat; - Major failures of the backscar followed immediately, completely cutting the upper road in 1958 and resulting in its permanent closure;
- From 1958 until 1988, retreat of the backscar has been rapid. Recession above the western mudslide has been continuous, whilst that above the eastern mudslide occurred primarily between 1957 and the late 1960s with a further phase of retreat by rotational sliding beginning in April 1986. The combined results of these events has been a mean retreat of the central backscar at 2.15 m per year between 1960 and 1987;
- Since 1988 the central western backscar has continued to retreat, whereas the eastern backscar has been relatively inactive and characterised by slow slippage down the face and disintegration of the 1986 failed blocks. Activity has increased in western parts of the complex resulting in a westward extension of backscar reactivation towards Timber Hill (Photo 24).
Backscar evolution has also been studied using a rigorous analytical photogrammetric technique based on a 42 year (1946-
On occasions, sediment supply at the mudslide toe exceeds marine erosion and temporary accretion occurs on the foreshore as mudslide lobes. Over the past 15 years marine erosion has exceeded the upslope supply so that mudslide lobes have been eroded back (Photo 24). Short-
E4 River Char to Westhay Water (see introduction to cliff and coastal slope erosion)
This sector includes the landslide complex of Stonebarrow Hill (elevation up to 147mOD) together with lower cliffs of 30m-
Map and aerial photo-
Significant quantities of beach forming sediments are supplied from Upper Greensand Chert Beds and overlying flinty deposits present in the Stonebarrow backscar (Bray, 1996). Analysis of Coastal Monitoring Programme lidar (2007 and 2011) and aerial photography (2012) data indicates cliff erosion is ongoing with 1-
E5 Westhay Water to St Gabriel's Water (see introduction to cliff and coastal slope erosion)
The coastal cliffs that cut into the southeast flank of Chardown Hill are composed primarily of Lias Clays, but with variable overlying cover of gravel-
At Broom Cliff, accelerating retreat has been recorded since 1901 suggesting that the system is undergoing a prolonged active phase. Although it is possible that the system will eventually become so choked with debris that retreat could slow down in the future, no such signs are discernible. Observations of the system between 1984 and 1989 revealed intense mudsliding and excavation of debris from within the landslide complex, thus suggesting that recent rates of backscar retreat could be maintained or even accelerate. Retreat over the period 1960-
Analysis of Coastal Monitoring Programme lidar (2007 and 2011) and aerial photography (2012) data indicates minimal cliff recession with less than 1,000m³ per yearof beach grade sediment supplied to the foreshore, due to the lack of coarser materials within the cliff geology, with fine grained material transported into the nearshore zone in suspension and not retained on the foreshore. This revised volume of cliff derived input is a reduction from the 2004 estimated volume of more than 20,000m³ per year.
E6 Golden Cap (see introduction to cliff and coastal slope erosion)
The Golden Cap headland (Photo 16) forms the highest cliff (191mOD) within the study area and exhibits a markedly steeper profile than the landslide systems to the west. This may be related to geological differences, but increased wave exposure is also cited as a possible factor (Brunsden and Goudie, 1981; 1996). Retreat is variable and some cliff sections have showed no measurable retreat in recent decades, whilst others along its western flank receded at up to 1.0m per year (Bray, 1996). Long-
Cliff geology comprises Lias clays, sands and limestones overlain by Upper Greensand Foxmould sand and thin Chert Beds. Analysis of Coastal Monitoring Programme lidar (2007 and 2011) and aerial photography (2012) data indicates that less than 1,000m³ per year of beach grade sediment is supplied to the foreshore, a reduction from the 2004 estimated volume of more than 20,000m³ per year. Fine grained sand material transported into the nearshore zone and not retained on the foreshore. Large limestone boulders are supplied from the Three Tiers unit of the Middle Lias, forming dense foreshore aprons, which effectively trap any gravel supplied and prevent output to adjoining beaches (Bray, 1996). The boulder aprons provide protection against wave attack because they induce offshore breaking of large waves; so dissipating some of their energy.
E7 Seatown (see introduction to cliff and coastal slope erosion)
Cliffs backing Seatown Beach differ with respect to geology and morphology either side of the River Winniford (Photo 27). To the west, cliffs are of Lower and Middle Lias clay with a wide degradation zone. Backscar retreat is rapid on the eastern flank of Golden Cap (up to 1m per year for 1960-
Between the River Winniford at Seatown, and Doghouse Hill (Photo 3 and Photo 28) the cliffs are formed within sandy units of the Middle and Upper Lias and the coastal landslide complex is very narrow, being some 40-
Analysis of Coastal Monitoring Programme lidar (2007 and 2011) and aerial photography (2012) data indicates that less than 1,000m³ per year of beach grade sediment is supplied to the foreshore, a reduction from the 2004 estimated volume of more than 20,000m³ per year. There is a negligible supply of gravel due to cliff geology. Fine grained sand material, supplied from the Middle Lias strata, are transported into the nearshore zone in suspension and not retained on the foreshore.
E8 Thorncombe Beacon (see introduction to cliff and coastal slope erosion)
Degradation of predominantly sandy Upper and Middle Lias sediments has created high cliffs (up to 155mOD) of relatively steep profile (Photo 18). Retreat averaged 0.17m per year over the period 1901-
E9 Eype and West Cliff (see introduction to cliff and coastal slope erosion)
Cliffs along this segment are lower and of distinctly different geology either side of Fault Corner, which marks the plane of a major fault with marked downthrow to the south-
Analysis of Coastal Monitoring Programme lidar (2007 and 2011) and aerial photography (2012) data indicates that less than 1,000m³ per year of beach grade sediment is supplied to the foreshore, a reduction from the 2004 estimated volume of more than 20,000m³ per year. There is a negligible supply of chert or flint gravel is supplied from the cliffs due to absence of suitable deposits. Fine grained sand material are transported into the nearshore zone in suspension and not retained on the foreshore.
E10 East Cliff and Burton Cliff (see introduction to cliff and coastal slope erosion)
Near vertical sandstone cliffs extend east from East Cliff, West Bay (Photo 11) to Burton Cliff (Photo 12), where thin oolithic limestones cap them. Further east towards Cogden, there are clay cliffs of Fuller’s Earth. All cliff sections are devoid of flint and chert (Bray, 1986; 1996). The sandstone cliffs are composed of Bridport Sands and possess a number of bands of harder calcareous sandstone. As the cliffs gradually retreat, the more resistant material is released as boulders or cobbles, which temporarily contribute to beach volume before wave action results in rapid abrasion and disintegration. Recession of these sandstone cliffs was investigated by map comparisons over the period 1902-
E11 Chesil Beach Recession (see introduction to cliff and coastal slope erosion)
Beach recession may supply sediment from underlying deposits that become exposed in the seaward beach face as the beach is pushed landward. Carr and Blackley (1984) report slabs of Forest Marble Limestone and peat being yielded and Moxom (2003) records some direct observations of this process. Observations of gravel clasts thrown over the crest by storms led several authors to postulate recession of Chesil Beach by “in-
Analysis of beach profiles measured originally by Coode (1853), with more recently surveyed profiles revealed that only opposite Portland Harbour was the amount of crest recession (17 m) greater than the possible errors (Carr and Gleason, 1972; Carr and Seaward, 1991). Comparisons of these data with aerial photos of 1993 revealed recession of the crest by 8m towards Chiswell and recession of the MHW by 10-
The sediments located beneath the beach have been investigated by several studies. Probing traverses of the Fleet revealed a 2.5m thick mud layer resting upon a gravely layer of unknown thickness (Bird, 1972). Borehole investigations indicated a deep channel (to –26mOD) between the mainland and the Isle of Portland (Carr and Blackley, 1973). This is infilled by thick sand, gravel and peat deposits, which have potential to supply Chesil Beach as it recedes. Other coring and borehole studies within the Fleet Lagoon have indicated black marine sands at depth with clays and peats above and a basal layer of cobbles (Coombe, 1998). Overall, it appears that only relatively small quantities of coarser materials could be yielded to the beach through reworking of the substratum due to the very slow rate of beach retreat, although this could alter in the future.
E12 The Fleet (see introduction to cliff and coastal slope erosion)
At several locations, erosion of the shores of the Fleet has created low cliffs and supplied sand and gravel to small local beaches (Bird, 1972). Sediment volumes are extremely small and material appears to be retained on thin local beaches on the Fleet. In places, e.g. Wyke Regis (Photo 13), cliff recession has resulted in formation of shore platforms several metres wide in limestones and siltstones of moderate resistance. These features are difficult to reconcile with the prevailing opinion of the Fleet as a low energy environment and suggest occurrences of active wave erosion in the past.
E13 West Coast of “Isle” of Portland (see introduction to cliff and coastal slope erosion)
The northwest Portland coast is subject to major landsliding where soft erodible Kimmeridge Clay is overlain by hard Portland Stone (Brunsden and Goudie, 1997). However, analysis of Coastal Monitoring Programme lidar (2007 and 2011) and aerial photography (2012) data indicates that cliff recession is negligible during this period. Fine-
Futher south, the west-
Sediment supply from the Isle of Portland is nonetheless indicated by presence on Chesil Beach of pebbles of Portland Stone and a distinctive dark chert found within the Portland Stone (Carr and Blackley, 1969; Jolliffe, 1979). Overall, it is envisaged that natural supply is extremely slow, although it probably was augmented at West Weare by tipping of significant, but undocumented quantities of quarry waste down the undercliffs – see (Photo 29) (Carr and Blackley, 1969; Jolliffe, 1979).
2.3 Fluvial Input
» FL1 · FL2
No major rivers discharge along the coastline of this unit. Chesil Beach forms a barrier in eastern parts so that the small streams draining its hinterland discharge into the Fleet Lagoon rather than into the open sea. To the west the small rivers Bride (Photo 31), Britt, Winniford (Photo 27), Char and Lim discharge to the shoreline. All are narrow gravel or sand-
Rendel Geotechnics (1996) studied potential fluvial sediment yields through the south coast region and found very little direct data available from which to make assessments. Therefore they undertook empirical estimations based on available discharge data coupled with assessment of sediment availability. They concluded that the West Dorset streams collectively had the potential to supply some 2,700m³ per year of suspended sediments and 300m³ per year of coarser bedload sediments (sands and gravels).
FL1 River Char (see introduction to fluvial input)
Large quantities of angular flint and chert gravel line the bed, but it is uncertain whether or how frequently these materials might be mobilised and transported towards the shore. Observations of the river at all times of the year during the period 1984-
Evidence of an episodic input is provided by a fan of gravel and shingle at the mouth of the Char (Photo 32), although some of this is composed of beach shingle displaced by river flow down the beach face as the tide retreats. The only record of an exceptional discharge for the River Char is provided by an oblique aerial photograph showing extensive flooding of the river at Newlands Bridge, 0.6km from the mouth (Chaplin, 1985). Flood waters extended up to 50m either side of the channel and it was reported that several caravans were carried along by floodwaters. Discharge is not measured routinely by the Environment Agency and its predecessors, so there are no direct data. Precipitation is measured just outside the catchment at Beaminster, Bridport and Lyme Regis. Records for 1979 showed that flooding occurred following intense rainfall on 30th May 1979.
In the absence of discharge and bedload transport information, the volume of gravel supplied to the beach was estimated by Bray (1996) using details of the fan deposited on the foreshore. The volume of material contained within the fan was estimated as being between 16,000m³ and 32,000m³. However, because the flood event is infrequent, its return period is uncertain. Existing records revealed a single flood between 1881 and 1989 suggesting a minimum 100 year return period thus giving a possible mean annual supply of between 160m³ per year and 320m³ per year. Despite being very imprecise, these estimates do suggest that fluvial supply is a relatively minor component of the long-
FL2 The Fleet (see introduction to fluvial input)
The Fleet is a shallow brackish estuarine lagoon, which receives fluvial discharge and tidal flow. Probing traverses and boreholes revealed several metres thickness of mud, which accumulated over the past 6000-
2.4 Beach Nourishment
» N1 · N2
The only recorded beach nourishment in the study area relates to 6,000m³ of imported gravel placed on the Marine Parade Beach at Lyme Regis, immediately North-
N1 Lyme Regis (see introduction to beach nourishment)
The urban frontage of Lyme Regis has suffered declining beach levels for several decades leading to exposure of sea-
N2 West Bay (see introduction to beach nourishment)
A series of studies including physical and numerical modelling was undertaken as part of the West Bay Coastal Defence and Harbour Improvements Scheme (e.g. Hydraulics Research, 1991e; HR Wallingford, 2000a; 2000b; 2000c). Based upon the results of these and other studies a scheme was developed involving construction in 2004 of a replacement West Pier and a range of other measures to increase beach stability and improve the coastal defences –see Photo 7 (West Dorset District Council, 2004b). A key element of the scheme due for completion in November 2004 is a replenishment of West Beach by some 18,000m³ of shingle. The East Beach is managed so as to maintain an optimum width of some 120m to 160m. The East Beach and Freshwater Beach beach management plan (CH2M, 2009) and West Beach, West Bay beach management plan (West Dorset District Council, 2012; CH2M, 2012) supercede previous plans, and have been formulated to include actions to import beach material if this width diminishes and recycle beach material to the east should it accrete beyond this width.
3. Littoral Transport
» LT1 · LT2 · LT3 · LT4 · LT5 · LT6 · LT7 · LT8 · LT9 · LT10 · LT11 · LT12 · LT13
Transport occurs along a series of pocket beaches between Lyme Regis and West Bay and along the 28km expanse of Chesil Beach between West Bay and the Isle of Portland. Headlands and artificial structures intercept drift resulting in the identification of four beach drift sub-
- Charmouth Beach (Lyme Regis to Golden Cap);
- Seatown Beach (Golden Cap to Doghouse Hill);
- Eype Beach (Doghouse Hill to West Bay);
- Chesil Beach (West Bay to Isle of Portland).
It should be noted that there are several additional transport discontinuities within some of these cells as detailed within the individual sections below.
Analysis of Coastal Monitoring Programme lidar (2007 and 2011), aerial photography (2012) and baseline topographic data supports net eastward littoral drift from Lyme Regis to West Bay, although reversals are also evident between Golden Cap and West Bay. The net drift direction on Chesil Beach is more difficult to discern for it is a swash-
Gravel accumulations occur on the western (updrift sides) of structures that intercept beach drift such as the Cobb, Lyme Regis and a rock groyne at Charmouth and headlands act as barriers to drift (Bird, 1989). Gravels increase in size from west to east on each of the pocket beaches and tracer experiments undertaken by Carr (1971) and Bray (1996) indicated that the largest pebbles moved the fastest suggesting that accumulations of these types should indicate the net direction of drift. Calibrated modelling of transport on Charmouth Beach by Bray (1996) indicated considerable drift reversals in eastward and westward directions, but with a net annual eastward drift.
LT1 Monmouth Beach (see introduction to littoral transport)
The Cobb, has existed in various forms since around the 12th century to provide shelter for Lyme Regis Harbour (Photo 33). However, since it became connected to the mainland in its present configuration in 1754, it has functioned as a large terminal groyne intercepting west to east drift promoting the up-
In 2009, the Coastal Monitoring Programme completed a 100% coverage swath bathymetry survey, extending offshore 1km from MLW between Petit Tor Point and Portland Bill. Between Monmouth beach and Lyme Regis the nearshore zone is dominated by a continuous rock platform. Geological features such as ridges and folds are discernible extending from the toe of the beach through the inter-
LT2 The Cobb (see introduction to littoral transport)
The Cobb extends across the foreshore well seaward of LWMST and effectively intercepts littoral drift of shingle (Photo 33). Initial structures date back to 1272-
The Cobb is not an absolute boundary to littoral movement, as evidenced by the accumulation of gravel between two arms of Lyme Regis harbour (Photo 34) that occurs under high-
Analysis of 2009 swash bathymetry data, offshore of Lyme Regis indicates that the variable thickness of nearshore sediments is generally sufficient to mask the underlying sub-
LT3 Lyme Regis (see introduction to littoral transport)
A northward change in the shoreline orientation to the east of the Cobb (Photo 8) means that there is a significant potential for eastward drift along Town Beach and Marine Parade (HR Wallingford, 2003) that results in sediment accumulations against the western sides of the various jetties and groynes along this frontage. Analysis of Coastal Monitoring Programme lidar (2007 and 2011) and aerial photography (2012) data supports a net eastward drift of 1-
LT4 Church Cliffs to Black Ven (see introduction to littoral transport)
Analysis of Coastal Monitoring Programme lidar (2007 and 2011) and aerial photography (2012) data supports a weak net northeastward drift of less than 1,000m³ per year of beach grade sediment, although the rate of drift varies according to wave height and approach direction, and supply of material. This volume is a reduction from the 2004 estimated volume of 3-
Fresh gravel is supplied to this segment by landslides from the Spittles and the western part of Black Ven. Eastward drift is intercepted periodically by lobes of landslide debris which surge seaward from undercliff mudslides and small beaches of angular gravel accumulate to the west of such barriers (Photo 15 and Photo 24). The Black Ven mudslide lobes have functioned as major barriers, since their extension across the foreshore in 1957 and 1958 and a beach of some 5,000 to 6,000m³ of gravel accumulated immediately to their west by the mid-
Analysis of 2009 swath bathymetry data, offshore of the Spittles, between Church Cliffs and Black Ven, indicates that the variable thickness of nearshore sediments is generally insufficient to mask the underlying sub-
LT5 Black Ven to the River Char (see introduction to littoral transport)
Field observations of eastward deflection of the river Char and sediment accumulation against the west side of two groynes constructed at Charmouth in 1954/56 and the 1994 rock groyne indicates an eastward transport. Analysis of Coastal Monitoring Programme lidar (2007 and 2011) and aerial photography (2012) data supports a net eastward drift of 1-
Analysis of 2009 swath bathymetry data, between Black Ven and Charmouth, indicates that the variable thickness of nearshore sediments is generally insufficient to mask the underlying sub-
LT6 Charmouth Beach (see introduction to littoral transport)
This segment comprises the beach extending from the river Char to Golden Cap (Photo 4 and Photo 25), where littoral drift is intercepted by the protruding headland and its lobes of landslide debris. The beach comprises of mixed sand and gravel in the west, but becomes increasingly dominated by coarse pebbles and cobbles towards Golden Cap.
Eastward deflection of the river Char, a gradual eastward increase in beach volumes and analysis of Coastal Monitoring Programme lidar and aerial photography data indicates a weak net eastward drift of less than 1,000m³ per year along this frontage. This volume is a reduction from the 2004 estimated volume of 3-
Beach drift has been studied by a variety of techniques including beach pebble sampling, aluminium tracer experiments and budget analysis involving consideration of sediment supply and storage (Bray, 1996). Analysis of some 6,000 pebbles from six transects located along the beach revealed longshore trends in size grading, roundness, sorting and pebble shape from which net littoral drift could be inferred. Pebbles were extremely angular at Black Ven, but become progressively better-
Littoral drift was measured directly by Bray (1996) during a series of experiments covering a nine month period and employing aluminium tracer pebbles. The tracers were efficiently recovered to a maximum depth of 0.45m beneath the beach surface. Recovery rates approaching 100% were achieved. Tests were conducted simultaneously on shingle (St Gabriel’s) and mixed sand and shingle (Charmouth) beaches during high, medium and low wave energy conditions. The data were analysed using multivariate techniques, and results indicate that shingle transport is most rapid on the upper beach near the high water mark and the larger tracers were the most rapidly transported. It was concluded that the observed increase in pebble size from Charmouth to Golden Cap could therefore have been developed by differential transport and sorting during net eastward littoral drift. Longshore transport volumes were calculated from the velocity, thickness and width of the moving shingle layer. The volumes were 2 to 22m³day-
At Charmouth, the application of a similar estimation procedure using a site specific CERC calibration derived from the tracer experiments indicated net eastward drift of around 5,000m³ per year, but 40% of the material is composed of sand and grit so that shingle drift is around 3,000m³ per year. Drift of the entire beach sediment size spectrum is therefore greatest at Charmouth, but decreases towards the east due to the progressive offshore loss of fines. Although the drift experiments themselves provided information of high reliability, the calculated long-
- Refraction and shoaling analysis was not possible for the tracer sites, so it was assumed that the inshore wave climate was similar to that of West Bay with adjustment for different shoreline orientation;
- The 1974-
84 West Bay wave climate was not necessarily representative of long- term conditions because subsequent studies have indicated a marked change in climate beginning in 1982 (Hydraulics Research, 1991d; Brampton, 1993). This has been shown to increase net eastward drift.
Bray (1996) produced local calibrations of the CERC equation for the St Gabriel’s (shingle) and Charmouth (mixed shingle and sand) sites and these are recommended for further modelling the West Dorset gravel and gravel/sand beaches.
A further check on the drift rates along this beach was undertaken by an analysis of the volumes and budgets of beach material and a comparison against the tracer/wave power derived values (Bray, 1996). Budget analysis showed that beach volume increased eastward, but gravel supply was concentrated in the west indicating that drift should increase eastward due to cumulative supply and increased gravel availability. Integration of these inputs together with probable outputs indicated net eastward drift of between 3-
It should be noted that the operation of these drift rates would suggest that a substantial beach should have accumulated against the Golden Cap headland since 1901. However, comparisons of old maps, field reports and the contemporary volume of the beach do not support this idea. Instead, the imbalance can be explained by intermittent phases of eastward littoral drift that occur beneath Golden Cap as explained by the following section.
LT7 Golden Cap (see introduction to littoral transport)
The high landslide complex of Golden Cap forms a headland due to the occurrence of thick resistant limestone seams of the Three Tiers unit that outcrop in the sea-
Analysis of Coastal Monitoring Programme lidar and aerial photography data supports a net eastward drift of 3-
“Impeded” and “Unimpeded” drift conditions have been identified occurring at the headland according to the relative intensities of mudsliding and marine erosion. At present, the combined effect of active mudslide lobes and dense boulder aprons is to completely block littoral drift of gravel along beaches, adjacent parts of the shore platform and within the nearshore (“impeded” condition). However, old photographs show that landslide debris became sufficiently eroded between 1934 and 1949 (and partially from 1949-
The westernmost mudslide at Golden Cap (Photo 17) remains active and observations of similar, though larger mudslides at Black Ven suggests that at least 20 years of marine erosion is required from cessation of major activity to re-
LT8 Seatown Beach (see introduction to littoral transport)
Seatown Beach comprises a small pocket beach some 1.8km in length bounded by high headlands to the west and east (Photo 3). The beach is extremely sensitive to short-
Analysis of 2009 swath bathymetry data, between Golden Cap and Seatown, indicates that the variable thickness of nearshore sediments is sufficient to mask the underlying sub-
A total of 3,000 pebbles were sampled by Bray (1996) and net eastward drift was indicated by longshore pebble grading which showed increased size, roundness, sphericity and sorting of linear dimensions to the east. The gradings were generally less well pronounced than on Charmouth Beach, which may indicate that drift is weaker or that clast sorting has been affected by historical beach mining at the site see section 4.2. Reliability is medium because sediment sampling was completed on a single day in 1985. However, numerous subsequent observations over several years suggest that the main trends identified were typical (Bray, 1990b) and studies by Laming (1988) and Bird (1989) have revealed a similar size grading.
LT9 Thorncombe Beacon (see introduction to littoral transport)
A continuous gravel beach formerly connected Eype and Seatown Beaches, but this link was broken by shingle depletion and subsequent landsliding at the Doghouse Hill (Photo 28) and Thorncombe Beacon (Photo 18) headlands (Brunsden, 1985; High-
Analysis of 2009 swath bathymetry data, offshore of Doghouse Hill, indicates that the variable thickness of nearshore sediments is insufficient to mask the underlying sub-
LT10 Eype Beach (see introduction to littoral transport)
This frontage comprises an open gravel beach from Thorncombe Beacon to West Cliff (Photo 2), where outcropping rock ledges and a rock groyne effectively separates West Beach from the main beach to the west. Analysis of Coastal Monitoring Programme lidar and aerial photography data indicates that net drift direction is not conclusive, as littoral drift is indicated to occur in both eastward and westward directions. Although the balance of evidence would appear to support a weak to moderate net component towards the east, in the order of 1-
Longshore trends in beach volume, size, grading and sorting support net eastward drift on the main beach, although West Beach has become severely depleted over the past 150 years making identification of drift difficult – see Photo 35 (High-
The long-
Analysis of 2009 swath bathymetry data, between Thorncombe and West Bay, indicates that the variable thickness of nearshore sediments is sufficient to mask the underlying sub-
LT11 West Bay (see introduction to littoral transport)
The piers at West Bay have effectively intercepted littoral drift since cavities in the structures were infilled in the 1820s (Jolliffe, 1979; Keystone Historic Buildings Consultants, 1997; High-
Analysis of Coastal Monitoring Programme lidar and aerial photography data indicated a weak westward drift along this frontage. However, net drift direction is not conclusive, as littoral drift appears to occur in both eastward and westward directions. Onshore and offshore sediment transport also occurs between the beach face and inter-
The process of change either side of the piers only dates back to the mid-
- Before construction of the present general harbour configuration in 1742-
46 (Keystone Historic Buildings Consultants, 1997), littoral drift would have been virtually unhindered in either direction, because the relatively small channel of the river Brit would have been the only obstacle. Drift is likely to have deflected the river mouth and blocked it periodically to allow intervals of free transport. It can be envisaged that a continuous beach would have stretched from the Isle of Portland, past West Bay to Thorncombe Beacon and probably as far west as Seatown (Brunsden, 1985; High- Point Rendel, 1997); - After harbour construction in 1746, channel maintenance by flushing using a sluicing system and training structures probably interfered with drift but had little net effect because no major trend for accretion or erosion was recorded and a continuous beach evenly distributed on either side of the piers was maintained (Jolliffe, 1979; High-
Point Rendel, 1997; Brunsden and Moore, 1999); - Beginning in the late 18th century landslides along the Doghouse Hill and Thorncombe Beacon headland engulfed cliff toe beaches and severed the drift pathway from the west. This isolated Eype and West Beaches from their only significant sources of natural supply;
- After 1820s, the infilled piers intercepted littoral drift and exchange between West Beach and East Beach was reduced. In combination with events outlined in iii. the effect was to cause depletion, erosion and set-
back of the West Beach by up to 100m (Jolliffe, 1979; High- Point Rendel, 1997; Brunsden and Moore, 1999). The situation was exacerbated from the late 19th century onward when the first esplanades and seawalls were constructed, causing wave reflection and scour. A total loss of 500,000m³ of beach material is estimated since the mid- 19th century. The separate identities of Eype, West and East beaches therefore date from this time.
Periodic occurrences of shingle accumulations in the harbour entrance indicate that the piers do not form a complete barrier to drift and limited bypassing is possible. This process has probably been facilitated by the documented accretion pattern to the east of the piers that built out the beach to the tip of the east pier by the early 1980s (Jolliffe, 1979; Hydraulics Research, 1978, 1985, 1991a). Fluorescent pebble tracer experiments undertaken over an 18-
LT12 Western Chesil Beach incl. East Beach (see introduction to littoral transport)
Chesil Beach is a swash-
The marked coastal setback to the west of the West Bay piers would appear at first sight to be the result of a classic terminal scour process immediately downdrift of the piers enabling confident identification of net east to west drift (Hydraulics Research, 1978; 1985; Jolliffe, 1979). Map comparisons and field survey covering 1901-
Analysis of Coastal Monitoring Programme lidar and aerial photography data indicated a weak but unquantified eastward drift along this frontage. However, net drift direction is not conclusive, as littoral drift appears to occur in both eastward and westward directions. Therefore, the arrows have been revised to indicate that no quantitative volumes have been determined, compared to the 2004 speculative 10-
It has proven difficult to understand drift at this location due to variations in wave climate to which the rate and direction of drift are extremely sensitive. SW approaching waves generate eastward drift so that East Beach erodes, whereas SE waves generate westward drift causing the beach to accrete against the eastern pier (Photo 9). Increase of the beach width to beyond 160m extended the beach face towards the end of the pier caused bypassing of gravel and accumulation in the harbour entrance. Erosion to widths of less than 120m significantly increases the risk of overwashing and possibly breaching e.g. Photo 36 (HR Wallingford, 2000c).
Fluorescent concrete tracer experiments undertaken over an 18 month period on East Beach adjacent to the piers revealed net westward drift (Jolliffe, 1979), but it is uncertain whether the study period was typical. The authenticity of these results was also questionable on the basis of the concrete pebbles used potentially being an unrepresentative tracer material (Carr, 1980). Littoral drift between Cogden and West Bay was further studied by means of a mathematical beach plan shape model (BEACHPLAN) employing a wave climate derived from hindcasting based on Portland Wave Data covering the period 1974-
Subsequent observations of the beach in fact indicated it to be eroding, suggesting a possible change in drift regime. Analysis of beach profiles and air photos covering the period 1977-
It appears that net littoral drift is very delicately balanced at this western end of Chesil Beach so that slight wave climate/storm frequency variations can cause significant drift reversals as clearly indicated by previous studies e.g. Brampton (1993). Available hindcast wave data still cover too short a time span to be sure that a truly “typical” wave climate has been defined making it difficult to establish a long term net drift rate and direction. It is also difficult to predict the likely future rates and directions of drift due to the possible effects of climate change as explained in the following section. Flexible and adaptive beach management underpinned by regular monitoring should provide for the best way to cope with the uncertainties.
LT13 Central and Eastern Chesil Beach (see introduction to littoral transport)
Analysis of Coastal Monitoring Programme lidar (2007 and 2011), aerial photography (2012) and baseline topographic data indicates that the net drift direction on Chesil Beach is more difficult to discern for it is a swash-
Chesil Beach is a swash-
Much of the central part of the beach, particularly the segment between Cogden and Langton Herring has until recently received relatively little attention except for sedimentological and topographic studies (Neate, 1967; Carr, 1969; Carr and Blackley, 1969; Carr and Gleason, 1972; Carr and Seaward, 1991). These studies yielded much valuable information, but failed to provide any clear indication of the net drift direction. Most earlier research has concentrated on the eastern segment between Wyke Regis and the Isle of Portland. Early tracer experiments using brickbats (Richardson, 1902) and painted pebbles (Adlam, 1960) showed net eastward transport governed by waves, which also caused preferential movement of larger material. These experiments were over very limited time periods so their results were in no way representative of long-
Modelling of drift using a long term hindcast wave climate for the Lyme Bay and South Devon SMP indicated that there was zero net drift, although gross drift to the east and west were significant. Chesil was one of the locations for which wave modelling exercises were undertaken as part of the DEFRA Futurecoast Project (Halcrow, 2002). An offshore wave climate was synthesised based on 1991-
Future drift variability was investigated specifically by Halcrow Maritime, et al., (2001) who undertook modelling of likely future wind speeds for a climate change scenario representing 2080 using the Met Office Hadley Centre Regional Climate Model. Initially, the present day conditions were modelled at Chiswell and West Bexington prior to examination of future conditions. Wind speeds output by the Regional Climate Model were used to derive offshore extreme wave conditions in Lyme Bay and results demonstrated a potential for significant increases in wave energy e.g. 1 in 50 year wave height of 8.1m could increase to 11.3m by 2080s. The hindcast waves have also been used to study the potential changes in alongshore sediment transport. The present condition at Chiswell was established as being a net westward drift of 900m³ per year based on a typical gross drift of 39,000m³ per year to the west and 38,000m³ per year to the east. At West Bexington a net eastward drift of 1,000m³ per year was estimated based on a typical gross drift of 21,000m³ per year to the west and 22,000m³ per year to the east. Assessment of the climate change results for Chiswell indicate a potential for a dramatic shift in the sediment transport regime due to a small two-
A similar type of study was undertaken by Sutherland and Wolf (2002) using an alternative climate model to generate future wave scenarios and then to simulate drift on Chesil Beach up to the year 2075. In this instance the present condition for a beach facing 225 degrees was estimated as being an eastward drift of 24,000m³ per year. Results suggested that net drift could in future increase by up to 30% due to the potential effects of climate change. The two numerical modelling studies discussed above present conflicting results with respect to establishing the present conditions on Chesil Beach. This is because they have set out to examine future scenarios rather than to focus on the present and to precisely predict the future. They have, however, generated some valuable insights suggesting that (i) waves in Lyme Bay are likely to vary with future climate change and (ii) Chesil Beach is likely to be sensitive to these changes with the potential for reversals and accelerations of drift. If such changes were to occur variations in beach morphology and volume would become most apparent at the two extremities of the beach where transport is impeded.
The unique longshore size grading of the beach is possibly related to the delicate balance of littoral drift along the coast. Most theories attribute the grading to wave action, although several in the 19th century, now largely discredited, also considered tidal mechanisms (Carr and Blackley, 1974). Differential transport has been widely advocated, with large waves from the south-
4. Sediment Outputs
The Isle of Portland acts a large terminal groyne that intercepts coarse beach sediments preventing them from leaving this coastal unit. There are, however, notable processes by which sediment is lost from the shoreline. Fine sediments are winnowed from beaches by waves and deposited offshore in Lyme Bay, whereas coarse sediments suffer losses from attrition and entrapment. Finally, this unit has a history of beach mining that has removed substantial quantities of shingle from the shoreline.
4.1 Onshore to Offshore Transport
Coastal landsliding transports large quantities of sediment to the beach (see section 2.2). Only the coarser materials are stable on the foreshore when exposed to wave action. The majority of sediments supplied are degraded and weathered clays, shales, mudstones and weakly cemented sandstones. These readily disintegrate under wave attack and their fine constituent grains/particles are transported offshore in suspension e.g. Photo 15. Transport pathways are uncertain, but it is likely that a significant proportion of sediment is deposited in Lyme Bay, because offshore surveys reveal that silts and fine sands of similar character are the dominant surface sediment within the bay (Institute of Geological Sciences, 1983; Dobbie and Partners, 1980; Offshore Environmental Systems Ltd., 1980; Bray, 1986). Clays are likely to be transported more widely into suspension to contribute to estuaries within Lyme Bay and possibly more widely along the English Channel. The offshore transport of fines therefore closely follows the pattern of sediment supply, with large quantities yielded from Black Ven and Stonebarrow and extremely small quantities from Chesil Beach (Bray, 1986; 1996).
Gravel and coarse sand are more stable on the foreshore and are generally the beach forming sediments (Bray 1986). Significant offshore shingle transport is unlikely due to absence of offshore banks or "sinks" revealed by the review of offshore information undertaken in section 2.1. Offshore loss of sand from the foreshore is likely, because extensive areas of the Lyme Regis sea bed are covered by this material type (Darton, et al., 1980; Institute of Geological Sciences, 1983; Bray, 1996; High-
A variety of studies including physical modelling (Hydraulics Research, 1989; HR Wallingford, 2003), numerical modelling (HR Wallingford, 2001) and geomorphological interpretation (High-
Analysis of 2009 swath bathymetry data, offshore of Lyme Regis, between Charmouth and Golden Cap, and offshore of West Bay indicates a lack of bedforms or downdrift accumulations of sediment in connection with rock ridge outcrops, and provides no evidence for an offshore pathway or offshore sinks of sediment. The speculative 2004 arrows have therefore been removed. Fine grained material is transported into the nearshore zone in suspension and not retained on the foreshore. The variable thickness of nearshore sediments is generally sufficient to mask the underlying sub-
4.2 Beach Gravel Mining
History of Extraction
The beaches of South-
Carr (1980a) estimated that between the mid-
Further to the west, the major extraction site was Seatown Beach (Photo 3). Between 1939 and 1945 large quantities of gravel were removed and eyewitness accounts suggest that the beach was almost completely stripped (Rhoden, 1974; Brundell, 1985; Laming, 1988). Assuming that the pre-
It should be appreciated that it was difficult to check on the exact quantities and qualities of gravel removed. Many of the figures quoted above are based upon planning consents and it has to be recognised that local authorities did not possess the resources to continually check that extraction remained within the approved quotas. Consequently, these figures may be underestimates.
Effect of Extraction
Chesil Beach is widely recognised as a unique scientific feature and also performs a vital coast protection/sea defence function. The beach is generally held to be a fossil barrier receiving no significant contemporary supply (Carr and Blackley, 1974; Jolliffe, 1979; Carr, 1978, 1980a, 1983b, 1883c; Bray, 1996; High-
Seatown Beach was subject to major wartime extraction, which must have severely depleted the beach and may be linked with beach loss from the foreshore beneath Thorncombe Beacon that has isolated Eype and West beaches from their sources of supply and has therefore contributed to their depletion (High-
Dredging
Dredging is undertaken in the West Bay harbour entrance to maintain a navigable channel. The amount removed has averaged 1,200m³ per year since at least 1964 (Jolliffe, 1979; Hydraulics Research, 1985; High-
4.3 Attrition
During transport by wave action on the beach, gravel clasts are subject to repeated impacts with other clasts and with the substratum. Attrition rate varies inversely according to the amount of attrition a clast has already undergone. Thus, fresh angular gravels from coastal landslides are most susceptible, whilst well-
- Attrition loss of freshly supplied gravel during the first year on the beach. This is estimated at 10% of the annual supply (Bray, 1996);
- A much slower attrition loss of gravel stored on the beach in excess of one year. This was determined indirectly by examination of improved pebble rounding downdrift and comparison of drift rates and duration (Bray, 1996). This technique indicated attrition loss equivalent to 0.2%pa of the beach store. This estimate requires validation because some pebbles may spend much time buried and hence attrition does not continually affect the relatively angular pebbles of Charmouth Beach. Losses are much less on more mature beaches so adjustment was required for Seatown and Eype Beaches (Bray, 1996). Using these techniques, the attrition outputs were calculated:
- Charmouth Beach = 1,260m³ per year
- Seatown Beach = 84m³ per year
- Eype Beach = 82m³ per year
These rates reflect rapid attrition of angular material supplied by landslides at Charmouth Beach. The technique was adapted for Chesil by High-
5. Transport in the Offshore Zone
» O1 · O2 · O3
Until recently, very little attention had been given to sediment transport in the offshore zone. Some broad pathways had been identified from bedforms and others were postulated according to the patterns of residual tidal currents. The Dorset Inner Shelf Seabed Mobility Study (Bastos and Collins, 2002) has made a major contribution to knowledge covering an area of around 10km to the east and west of Portland Bill and up to 5km offshore from the tip of the Bill. The study set out to investigate wave and tide driven transport at the bed, to identify transport pathways, predict seabed mobility and identify the effects of sandbanks and shoals. It involved assembly of existing information on seabed sediments and morphology, tidal currents and waves. Original field measurements included hydrographic and sidescan sonar surveys, sediment sampling, seismic boomer surveys of sediment layer thickness and 3D tidal current velocity profiling (Acoustic Doppler Current Profiler). Data collected were applied to develop numerical models of tidal flows (TELEMAC 2-
- A symmetrical arrangement of banks was identified to either side of the Isle of Portland. To the west, the sandy/shelly West Shoal (4-
8m sediment thickness) was identified in 30m water depth. Sand waves upon its surface strongly suggested east- south- eastward transport. To the southwest, the highly shelly Portland Bank was identified (8- 12m sediment thickness). Large sand waves upon its surface indicated convergent, or possibly clockwise rotational transport; - Tidal currents increase from 0.25-
0.50ms- ¹ within Lyme Bay southwards with strong currents of up to 2.5ms- ¹ in the vicinity of Portland Bill. During the tidal cycle tidal eddies develop on both sides of Portland Bill; - There is a high mobility of the generally sandy bed sediments. Fine sand was estimated to be mobile around the Bill and throughout much of eastern Lyme Bay for greater than 90% of the time. Coarse sand was estimated to be mobile for some 75-
90% of the time over Portland Bank and for 50- 90% over West Shoal. Its mobility was otherwise limited to areas close inshore within eastern Lyme Bay where heavy wave action can mobilise bed sediments; - Net sand transport operates towards Portland Bill and zones of sand convergence have developed to the east and west of the headland in association with the tidal eddies and the occurrence of sandbanks. Bastos and Collins (2002) provide two rather more detailed interpretations of the transport pattern in relation to (i) tidal eddies and (ii) peak tidal current asymmetry. The transport paths at and around the sandbanks are verified by bedforms and are believed to be of medium to high reliability;
- Maximum transport potential occurs at the tip of Portland Bill where the bed for several kilometres around comprised scoured bedrock because the transport conditions are erosive and too energetic for any local sediment to remain.
O1 General Eastward Flow, Lyme Bay (see introduction to offshore transport)
A general eastward flow is indicated in Lyme bay for fine sands. The flow is directed towards Portland Bill where is strengthens, being sufficient to transport coarse sands. It is produced by the combined interaction of tidal and wave induced currents at the bed.
Tidal models validated by measured currents revealed a general eastward residual tidal flow within 10km of the shore in Lyme Bay and a westward flow further seaward (Bowles, et al., 1958, Pingree and Maddock, 1977a; 1977b; Bastos and Collins, 2002). The east moving stream generally flowed parallel to the coast from Lyme Regis to Chesil Beach and was then deflected south and concentrated significantly by the Isle of Portland (Pingree and Maddock, 1977a; Bastos and Collins, 2002). This information was supported by studies undertaken for the Lyme Regis and Charmouth sewage outfalls (South-
Numerical modelling studies found that the fine sands of the bed of Lyme Bay would be highly mobile for much of the time making it likely that sediments are transported east-
O2 Tidal Eddy West of Isle of Portland (see introduction to offshore transport)
A clockwise tidal eddy that alters its location, size and strength during the tidal cycle was identified to the south-
An area of longitudinal furrows and ridge bedforms has been recognised some 10km off Portland Bill (well seaward of the limit of the Bastos and Collins 2002 study area) with orientations parallel to offshore flow (Institute of Geological Sciences, 1983). Surface sediment is predominantly gravel in this area (IGS, 1983), so it is possible that sediments up to this size are transported.
O3 Tidal Eddy East of Isle of Portland (see introduction to offshore transport)
A strong southwestward directed residual tidal flow operates from the east of the Isle of Portland and is associated with an anticlockwise tidal eddy and convergent sand transport focused upon the Shambles Bank. It converges upon Portland Bill and contributes to a potential for net southward transport at this point. These processes occur outside of the area of the unit currently under examination and are discussed fully within the Unit text covering the Isle of Portland and Weymouth Bay.
6. Sediment Budgets
Integration of sediment transport information enabled calculation of gravel budgets for Charmouth, Seatown and Eype Beaches by Bray (1996). These budgets are briefly presented here, but the original source should be consulted for further details. A budget for Chesil Beach based on that compiled by Rendel Geotechnics (1997) is also presented.
6.1 Charmouth Beach
A detailed long-
A gravel flow model constructed by Bray (1996) graphically demonstrates the supply and subsequent distribution of gravel on this beach (Photo 40). A key point is that the major beach accretion is towards the east, whilst the major landslide supply sites are to the west. Virtually no littoral drift is received from the west due to The Cobb and Lyme Regis defences. The western part of the beach system is therefore characterised by high sediment delivery from the cliffs and throughput on the beaches with relatively little beach storage. No material is sufficiently stable on the western part of Charmouth beach to provide long-
In recent decades landslides at Golden Cap have intercepted beach transport so that a period of beach accretion can be anticipated. Eventually the landslide debris should suffer marine erosion sufficient to enable a surge of drift as the sediments impounded rapidly move around the headland to Seatown Beach.

6.2 Seatown Beach
Gravel budgets for several intervals as well as a mean long-
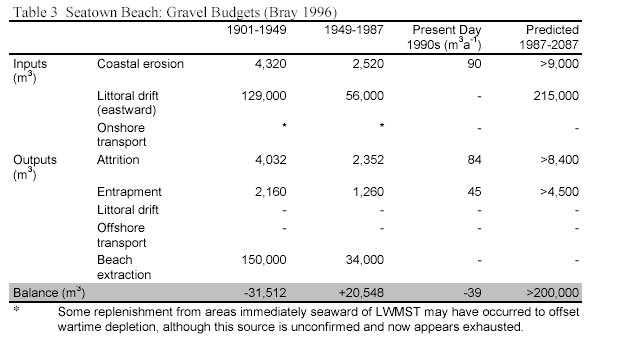
The effects of these changing inputs and outputs are illustrated by the alternative budgets calculated for various time intervals and explained as follows:
1900-
Over this period Seatown Beach received significant gravel inputs from neighbouring Charmouth Beach during an "unimpeded" transport condition covering the period 1934-
1949-
During the early part of this period the beach continued to receive additional material as shingle drifted intermittently beneath Golden Cap before landslides finally blocked that pathway in 1960. Thereafter, beach mining was the major influence, resulting in net shingle loss and beach depletion. Recent increases in the recession of both the base of the sea-
Present Situation
At present, the shingle budget of Seatown Beach is delicately balanced with relatively small inputs and outputs resulting in slow net depletion of 39m³ per year. This situation is expected to continue for at least the next twenty years until marine erosion of mudslide lobe barriers beneath Golden Cap is sufficient to permit incoming shingle drift from Charmouth Beach.
Future Evolution
Understanding of the general principles of the Seatown Beach gravel budget allows estimation of future evolution given that (i) the rate of sea-
The natural state of Seatown Beach appears one of episodic accretion by pulses of shingle supplied from Charmouth Beach during brief intervals of unimpeded transport beneath Golden Cap. Now that extraction has ceased, accretion should resume when inputs from the west again become possible, perhaps shortly after 2020. Until this time, Seatown Beach will remain in a delicate state of balance with slight net loss (39m³ per year). The recent trend for increased backscar and sea-
In conclusion, before 1900, Seatown Beach was probably of significantly greater volume than at present and was maintained by a balance between inputs and outputs regulated by the two headlands. Between 1900 and 1987, rapid beach gravel extraction was sufficient to unbalance the system resulting in accelerated coastal erosion. With the cessation of mining in 1987, a series of accretionary phases should be initiated after 2020, which should eventually return the system to its pre-
It should be noted that the pocket beaches of this shoreline operate as a complex system that is sensitive to artificial and natural disturbances. For example, the projected gravel budget at Seatown may be modified in the following manner by an accelerating rate of sea-
- Although cliff erosion will probably increase, gravel inputs will remain small because only limited quantities are present within the cliff behind the beach;
- Erosion of mudslide lobes beneath Golden Cap may initially accelerate so that unimpeded littoral drift might occur earlier. However, the unloading effect produced at the mudslide toe may trigger additional landslide activity and more frequent blocking of the foreshore. The net effect is not easily assessed;
- Climate change and sea-
level rise might significantly increase cliff erosion gravel inputs to Charmouth Beach and thus cause accelerated beach build- up against the western side of mudslide lobes beneath Golden Cap. In time, this might allow more frequent, higher magnitude and prolonged phases of unimpeded drift eastward.
6.3 Eype Beach
A long-
A major uncertainty concerns the fate of the lost beach material because it is unlikely that much could have been supplied eastward to Chesil due to the coastal setback that was produced as West Beach depleted. The only feasible explanation is of a massive offshore loss of fines from the beach and its substratum. A major offshore loss of coarse gravel is considered unlikely because nearshore surveys have failed to identify any corresponding deposits on the seabed (High-

The present Eype Beach is therefore a relict shingle accumulation characterised by depletion or undernourishment, albeit at a slow rate. It is uncertain whether further episodes of offshore loss could occur. Although West Beach has been artificially replenished with 18,000m³ of shingle, new coastal defences have been designed to avoid such occurrences. If it is assumed that further offshore losses do not occur from Eype Beach the future evolution of the beach may involve the following:
- Attrition of the finite shingle volume of Eype Beach will gradually result in decreased pebble size and increased roundness. In time, this may cause reduction of the beach face gradient and some shingle might become reduced to a size susceptible to offshore transport;
- The gradual diminution of beach volume has, and will continue to reduce protection to the toe of the sea-
cliffs, allowing increased marine erosion. Because the gravel content of the cliff- forming deposits is negligible, increased coastal retreat is unlikely to provide adequate beach replenishment. Although limestones from the Forest Marble and calcareous sandstones from the Bridport Sands are supplied by erosion of these cliffs, their limited quantity and low durability restricts their replenishment potential; - Natural drift inputs are unlikely in the future. Beach depletion and increased coastal recession reduces the likelihood of a continuous shingle beach reforming beneath Doghouse Hill so as to link Seatown and Eype Beaches.
6.5 Chesil Beach
Compilation of the information collected by this study has enabled construction of a budget for the beach presented in Table 5. The budget has altered through time due to changes in inputs from the west and outputs by mining, although the other elements have remained constant. Three alternative states can be identified:
Late Holocene to 1820s
Prior to construction of the Cobb, Lyme Regis and the piers at West Bay drift inputs from the West Dorset and East Devon coasts could have been as great as 8, to 12,000m³ per year (Bray, 1996). These inputs would have dominated the budget so that the beach would have been in an accreting condition. Bray (1996), High-
1820s to 1986
From the 1820s onward drift from the west would have ceased due to infilling of the West Bay piers. The beach altered from an open to a closed system isolated from any major shingle supplies. At this point losses become important to the beach and in the 20th century some 750,000 cubic metres of gravel were mined prior to cessation of operations in 1986. The assessment in Table 5 is therefore that outputs totalling 17,400m³ per year could have occurred.

Post 1986
Following cessation of the last remaining mining operation in 1986 the beach has depleted much more slowly with net losses of 1,400m³ per year due to drift bypassing of West Bay East Pier and attrition of the gravel as it is worked by waves. Although the beach has suffered substantial depletion over the past two centuries, the effects on profile and crest height are not easily determined due to the massive volume of the beach and high potential for rapid shingle redistribution. Recent measurements show variable but widespread lowering and some recession of the Chesil Beach between Chiswell and Wyke Regis (section 1.2). Following concerns over possible increases in damaging flooding events at Chiswell a coastal defence scheme was constructed involving measures to improve drainage within the beach and also novel gabion mattresses (Photo 41) to reinforce the stability of the crest (Hook and Kemble, 1991; Heijne and West, 1991).
The depletion of the beach has generated some debate concerning its likely future evolution and its resilience to climate change and sea-
7. Opportunities for Calculation and Testing of Littoral Drift Volumes
Data collected by the Defra-
The Southwest Regional Coastal Monitoring Programme commenced in 2006. The Lead Authority is Teignbridge District Council, with data collection, analysis and reporting led by a specialist team at Plymouth Coastal Observatory (PCO). Although at present a relatively short-
The shoreline to the west of West Bay has been studied in detail by Bray (1996) who successfully combined sediment tracing, wave power transport modelling and sediment budget analysis to derive estimates of drift on each beach. Useful further work would be to monitor the volumes of each of the pocket beaches in order to test those estimates and/or detect any changes in regime. Certainly, monitoring of beach replenishments at Lyme Regis and West Bay would enable likely drift rates to be ascertained from changes in beach volume (with allowances for the effects of control structures).
There are major opportunities to study drift occurring along Chesil Beach to obtain a clearer understanding of its overall drift regime. Previous studies have measured or modelled drift at only a few sites rather than investigating the beach as a whole. A possible approach would be to set up a numerical transport model (perhaps a beach plan shape model) and to attempt to calibrate it for the whole beach. This would be a major undertaking that would involve the following key elements:
- Production of representative inshore wave climates at several points along the beach (preferably based on 25-
30 years of hindcast data to overcome the problem of wave climate variability); - Application of different gain sizes for modelling at different locations along the beach so as to simulate the effect of the unique size grading upon transport (transport efficiency is known to be very sensitive to grain size);
- Attempt to calibrate the model using known morphological changes along the whole of the beach. The 1993-
95 aerial photography and photogrammetrically derived profiles provide a baseline with which a contemporary survey could be compared. Ground modelling techniques could be applied to determine changes in beach volume between surveys. Assessment of the likely errors of survey and ground modelling would be required to separate clearly those volume changes indicative of drift occurring between survey intervals.
8. Knowledge Limitations and Monitoring Requirements
The Southwest Regional Coastal Monitoring Programme commenced in 2006. Although a relatively short duration of quality data collection, analysis of the data between 2006 and 2012/13, combined with other datasets, academic research and historical studies has enabled sediment budgets, transport rates and directions to be identified or verified. However, at certain sites either due to a lack of long-
There has been an impressive increase in both the quality and quantity of knowledge and understanding of the coastal sediment transport process system on this frontage. A series of studies at both Lyme Regis and West Bay have offered deep insights into the coastal processes and longer-
Notwithstanding results from the Southwest Regional Coastal Monitoring Programme, and the summarised information collated in the Durlston Head to Rame Head SMP2 (SDDCAG, 2011), recommendations for future research and monitoring that might be required to inform management include:
- Formulation of initial cliff behaviour models for each main section of cliff line based on methods set out within the recent DEFRA Soft Cliffs Project (Lee and Clark, 2002). Existing data together with updated cliff top positions, site reconnaissance and geomorphological interpretation should be sufficient to achieve this and provide a basis for estimation of future styles and rates of landslide activity;
- Littoral drift has been studied in West Dorset using a variety of techniques involving both field experiments and mathematical modelling, but these have yet to be effectively combined. In particular, the CERC transport equation has been calibrated using tracer experiments on West Dorset beaches by Bray (1996) and it is suggested that these should be utilised in future modelling studies to increase the realism of the prediction process. Studies of drift on Chesil covering the whole beach are also needed.
- A public-
access long- term archive of survey material relating to Chesil Beach should be established. Due to its size and capacity for short- term change, long- term trends on the beach can only be determined by comparative studies covering long time periods. Existing data sets should therefore be compiled together with detailed description of survey techniques and field conditions etc. Information should include hydraulic studies, beach morphometry, sedimentology and geology; - Losses from beaches occurring due to attrition of pebbles during wave action are uncertain. Attrition is a particularly important factor on South-
West Dorset beaches because: (i) all are primarily composed of gravel; (ii) many beaches are now closed systems and attrition represents a significant net sediment loss; (iii) rapid coastal erosion supplies large quantities of terrestrial gravels and these are particularly susceptible to attrition; (iv) little is known of attrition on replenished beaches and (v) existing estimates of attrition are approximate and uncertain. Several approaches to this problem have been considered (Bray, 1996) and it is concluded that fundamental research will be required involving linkage of laboratory abrasion experiments to field conditions and validation by comparative studies on naturally and artificially replenished beaches; - Future evolution scenarios for Chesil Beach and the Fleet Lagoon could be produced in greater detail than presently available and should include an assessment of the potential consequences for habitats.
 LITERATURE REVIEWPHOTOSMAP 8 Lyme Regis - West BayMAP 9 West Bay - Portland Bill
Index
08. Lyme Regis to Portland Bill
Reference Maps
Directional Wave Roses

01 |
|
|
02 |
|
|
03 |
|
|
04 |
|
|
05 |
|
|
06 |
|
|
07 |
|
|
08 |
|
|
09 |
|
|
10 |
|
|
11 |
|
|
12 |
|
|
13 |
|
|
14 |
|
|
15 |
|
|
16 |
|
17 |
|
|
18 |
|
|
19 |
|
|
20 |
|
|
21 |
|
|
22 |
|
|
23 |
|
|
24a |
|
|
24b |
|
|
25 |
|
|
26a |
|
|
26b |
|
|
27a |
|
|
27b |
|