


KEY |
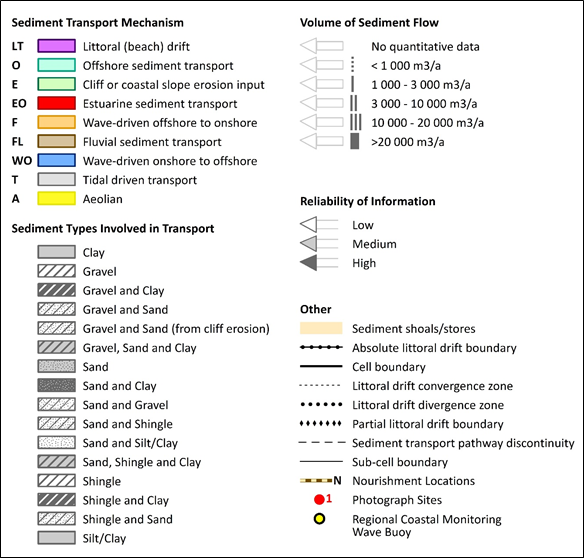
Sediment transport mechanism |
Definition |
|
LT |
Littoral (beach) drift |
Gross and net rates and volumes of shore- |
|
O |
Offshore sediment |
Movements of sediment entirely in the offshore zone, including inference of direction(s) from bedforms and banks, bars etc. |
|
E |
Cliff / Coastal slop erosion |
Sediment yield composition; weathering and erosion processes; erosion rates and input volumes |
|
EO |
Estuarine sediment |
Directions and volumes of sediment transport within, and at the mouths of, estuaries by tidal currents and/or waves; sediment composition; thicknesses and volumes |
|
F |
Wave driven nearshore and offshore zone |
Movement of sediment in the nearshore zone driven by waves |
|
FL |
Fluvial input |
Sediment delivered to estuaries and open coasts via river discharge; composition and input volumes |
|
WO |
Wave driven onshore to offshore |
Output from beaches; tidal deltas and nearshore bar topography; transport rates and volumes |
|
T |
Tidal driven |
Tidal currents are the exclusive method of transport |
|
A |
Aeolian |
Wind transported net onshore input, normally to beach backshores and dunes; dune stabilisation |
|
N |
Beach and Estuary recharge / nourishment / recycling |
Volumes of input, with initial and subsequent dates; sediment composition; post- |
|
Table 1: Sediment transport mechanisms |
||
|
Reliability |
Information source |
Criteria |
|
High |
Field studies or well validated models |
Temporally representative |
|
Spatially representative |
||
|
Appropriate methodology |
||
|
Appropriate statistical analysis |
||
|
Fully referenced |
||
|
Independent corroboration available |
||
|
Medium |
Some original data sources but temporally or spatially unrepresentative |
Some analytical deficiencies |
|
Review study with some dubious material |
||
|
Results which are difficult to attribute as high reliability |
||
|
Incomplete referencing |
||
|
Low |
Unrepresentative data or generally not primary resources |
Short- |
|
Weak experimental design |
||
|
Too generalised |
||
|
Mostly secondary sources |
||
|
Unattributed information |
||
|
Table 2: Reliability criteria |
||